Question 1 (a)
Graph for the market and a typical firm
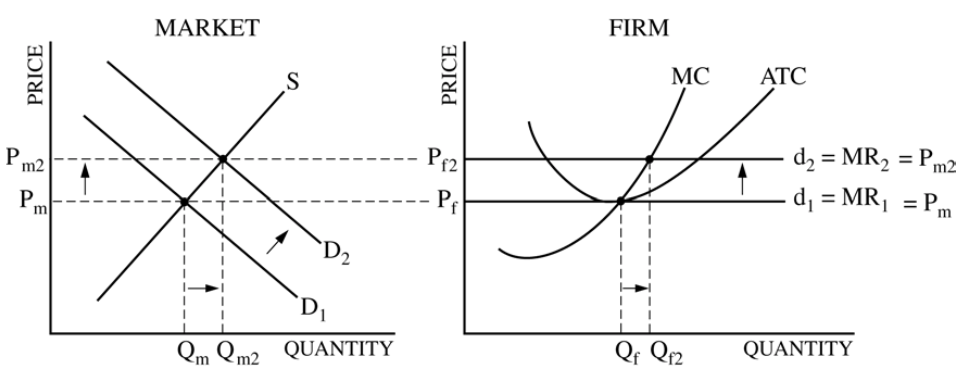
Graph for a typical firm should include
Marginal Cost
Marginal Revenue
Demand (Price)
Average Total Cost
Question 1 (d)
Long-Run Average Total Cost
Short-run and long-run average total cost curves differ because a firm can choose its fixed cost in the long run.
If a firm plans on producing a high amount of output, it might make sense to have a high fixed cost
Conversely, if a firm plans on producing a small amount of output, it might make sense to have a low fixed cost
![Cost of case Economies of scale Diseconomies ofscale سس سكسر ATC6
ATCg \]RATC 3 Quantity of salsa (cases)](media/image110.png)
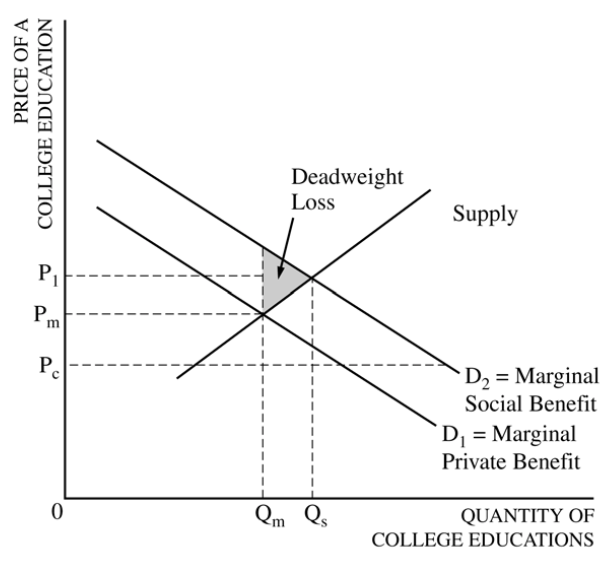
Question 2 (a)
Positive Social Externality
Question 2 (b)
- The price ceiling will increase the deadweight loss, because providers will decrease the quantity.
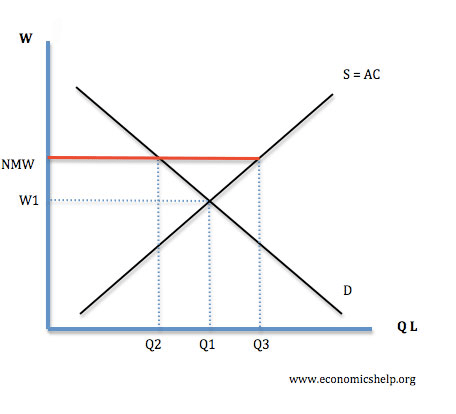
Question 3 (c)
the MFC curve (or the supply curve for labor) becomes horizontal at the minimum wage up to the quantity of minimum wage